Moving beyond a notebook
An exploratory notebook helps someone understand what happened once. An operational team usually has a more repetitive problem: check the same set of numbers every morning and notice quickly when one of them behaves differently.
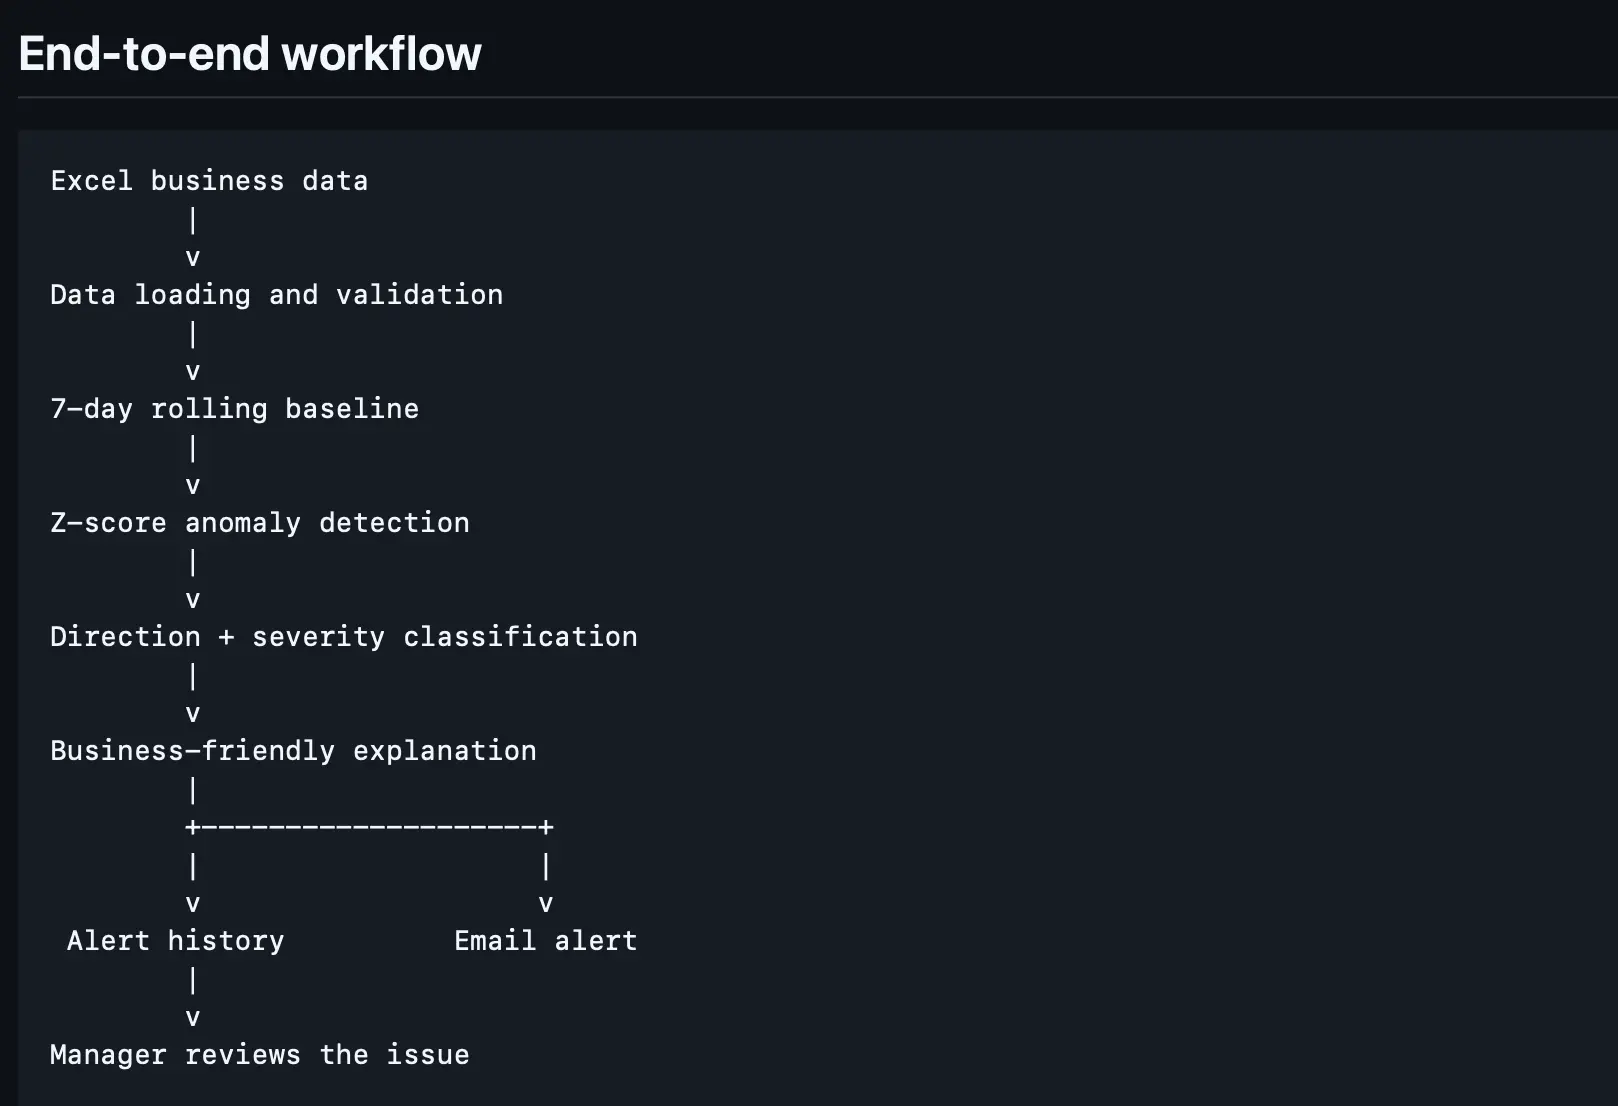
This project turns an Excel input into a repeatable monitoring workflow. It checks traffic, orders, conversion, average order value, revenue, marketing cost, refunds and refund rate, then logs and explains material exceptions.
The aim was not to build the cleverest detector. It was to build one a manager could understand, inspect and challenge.
A transparent statistical baseline
For each monitored metric, the latest value is compared with the previous seven days. The workflow calculates the rolling mean, rolling standard deviation, percentage movement and z-score.
Normal
The current movement remains within the chosen routine range.
Medium
An unusual movement worth recording and reviewing.
High
A material exception that deserves prompt attention.
Critical
A large departure from recent behaviour.
The synthetic dataset includes a few known incidents such as a traffic spike with weak conversion, a revenue decline, a marketing-cost spike and a refund surge. These planted events make it possible to test whether the workflow surfaces meaningful patterns rather than only random noise.
From spreadsheet to stakeholder alert
The workbook remains useful by itself. Its monitor and dashboard sheets show the current value, baseline, standard deviation, percentage difference, direction, severity and explanation. The Python layer reproduces the logic and turns it into a scheduled watcher.
Detection and interpretation are separate
The statistical layer decides whether the number is unusual. A second rules layer translates that result into a useful investigation prompt. A fall in orders points towards traffic and conversion; a rise in marketing cost points towards campaign changes and return on spend; a refund spike points towards product, fulfilment or service issues.
This is deliberately phrased as a direction to investigate, not an automated claim about root cause. The system knows which metric moved. It does not know why without further evidence.
Example: “Revenue is materially below its recent baseline. Inspect orders, conversion and average order value.” That is much more actionable than returning only “z = −3.2”.
Credentials are provided through environment variables rather than stored in source. If email configuration is absent, the script still runs, prints the result and writes the alert log while safely skipping notification.
Where this method stops being enough
A fixed seven-day baseline does not handle every seasonal pattern. In production, Mondays may need comparison with previous Mondays, different metrics may need different thresholds and repeated alerts may need suppression.
Z-scores also suit relatively stable behaviour better than heavily skewed distributions. Median absolute deviation, interquartile range, EWMA, forecasting residuals or an Isolation Forest may be better for some metrics.
The current version checks KPIs independently. A stronger production system would model correlated movement, keep configuration outside the code, log to a database and route alerts to the team’s normal channel.