Make the management decision clearer
The Cornerstone housing assessment asked for a dashboard or analytical report and a presentation explaining the model, validation approach, findings, limitations, risks and recommended actions. My focus was on three practical questions: how well are repairs performing, what does that mean for residents, and where should management investigate first?
This is a synthetic assessment, not a report on Cornerstone's actual service performance. The results below describe the supplied exercise data. The value of the project is the analytical process and the decisions it supports.
A useful performance percentage needs a clear scope, a defensible denominator and enough evidence to explain what should happen next.
Start with the records behind the numbers
I inventoried all seven operational extracts: properties, residents, tenancies, contractors, repair types, repairs and complaints. The eighth data sheet was a dictionary describing the fields. For each table I checked what one row represented, candidate identifiers, links to other tables, data types and missing values.
Five duplicated identifiers were corrected using clear sequential evidence, with those decisions retained as assumptions for data-owner confirmation. Unmatched records remained visible. Invalid costs, scores or dates were excluded only from the calculation they affected; no rows were silently deleted to improve the result.
Keep repairs and complaints at their own level
The semantic model has two fact tables and five dimensions. Repairs contains one row per repair job; complaints remains a separate table linked to the repair it concerns. This avoids multiplying repair counts and costs when complaints are analysed.
Property, tenancy, contractor, repair type and date provide the filtering context. Resident attributes were merged into tenancy, and a calendar was added for consistent monthly analysis. All seven operational source domains were used; the data dictionary informed the definitions.
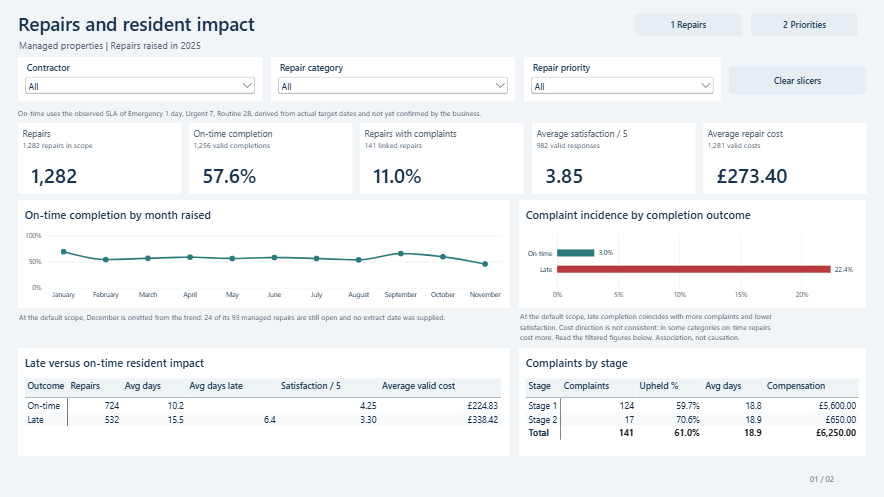
1,282 repairs
Managed homes, repairs raised in 2025. The full source has 1,350 repairs; 67 unmanaged and one unidentified-property repair sit outside this scope.
1,256 valid completions
Only repairs with valid completion and target information contribute to the on-time rate: 724 ÷ 1,256 = 57.6%.
Complaint incidence
The proportion of scoped repairs with a linked complaint. This is not the percentage of residents who complained.
Definitions used consistently
41 model measures include numerical results and report-support measures. The independently reconciled numerical suite contains 32 measures.
Check the arithmetic and what people actually see
All 32 numerical measures were independently recomputed from the original workbook and reconciled with the semantic model. The seven prepared source tables were compared cell by cell, with differences checked against the documented preparation decisions.
The working pack's 108 formulas were checked for errors and stale cached results. Derived fields were checked across all 1,350 repair rows. A one-to-two-hour timestamp shift was investigated: it caused no date-key changes, and lateness was checked against original timestamps.
Rendering checks found five problems that structurally valid report files had missed, including clipped rows and a missing total. Those were corrected, alongside genuine zero rates displaying as blanks. The final two-page report, slicer reset, screenshots and presentation were inspected as delivered.
Validation included source reconciliation, calculation checks and visual inspection. Each catches a different kind of failure.
Two pages, two management questions
Repairs and resident impact establishes the overall position: headline measures with supporting counts, monthly performance, and the outcomes associated with on-time and late repairs.
Operational priorities explores contractor and repair-type variation, contractor performance within each priority, and damp and mould. Completion counts sit beside rates so a small group does not appear more conclusive than it is.
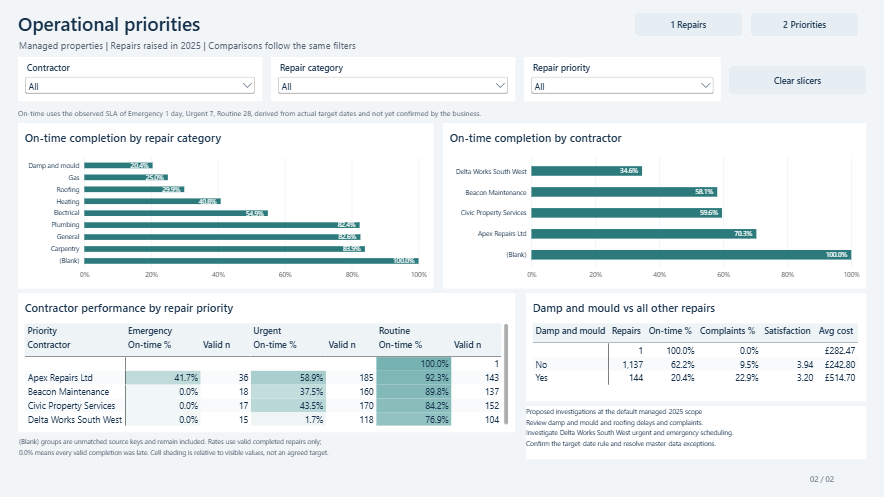
Slicers in the completed report support contractor, repair-type and priority investigation, with a reset to the default reporting view. Unmatched source references remain visible as blank categories. These are screenshots; the working pack, presentation and validation notes are available in the repository.
Turn the findings into a review plan
- Timeliness: 724 of 1,256 valid completions met the supplied target date, or 57.6%. The largest gaps were in higher-priority work, supporting a review of scheduling, capacity and escalation.
- Resident experience: complaint incidence was 22.4% for late repairs versus 3.0% for on-time repairs. This supports reviewing complaint-linked cases and communication, while recognising that complexity may affect both delay and outcomes.
- Contractor focus: Delta Works South West's urgent work warranted investigation: only two of 118 valid urgent completions were on time. I recommended comparing job mix and examining cases before attributing responsibility.
- Damp and mould: the 144 repairs combined a 20.4% on-time rate with 22.9% complaint incidence. Diagnosis, specialist capacity, communication and follow-up are practical areas for case review.
The outcome is a management view with reproducible measures and prioritised recommendations. The exercise does not demonstrate that these recommendations were implemented or that real-world service outcomes improved.
Be clear about what the evidence supports
The supplied target dates drive the on-time findings. Their relationship to agreed service standards still needs business confirmation. Contractor comparisons are descriptive, with priority, complexity and small emergency samples affecting interpretation; association does not establish causation.
I withheld repeat-repair and current-backlog KPIs because the definition or extraction context was insufficient. Resident-characteristic comparisons were also withheld where the tenancy-to-property linkage did not support them reliably.
The working pack preserves the preparation trail, but its Excel Dashboard category breakdowns total 1,281 rather than 1,282 because of unmatched references. Its measure-reference sheet also predates final DAX refinements. The repository documents these limits; the delivered Power BI model is the reference for final measures and full totals.