Turning a spreadsheet into a set of decisions
MegaWidget is a fictional manufacturer facing a familiar question: the business can change borrowing terms, advertising spend, margin assumptions and delivery arrangements, but each choice affects cash at a different point.
The workbook cleans the supplied sales data, models the operating and financing effects, and makes alternative assumptions comparable without rewriting formulas for every scenario.
The useful output is not one forecast. It is the ability to see which assumptions create the forecast and how sensitive the result is when they move.
A workbook with a repeatable refresh path
Refresh and recalculation macros keep the workflow consistent. Pivot-based summaries make the model easier to inspect while the assumption cells keep the decision levers explicit.
The default case exposed a cash problem
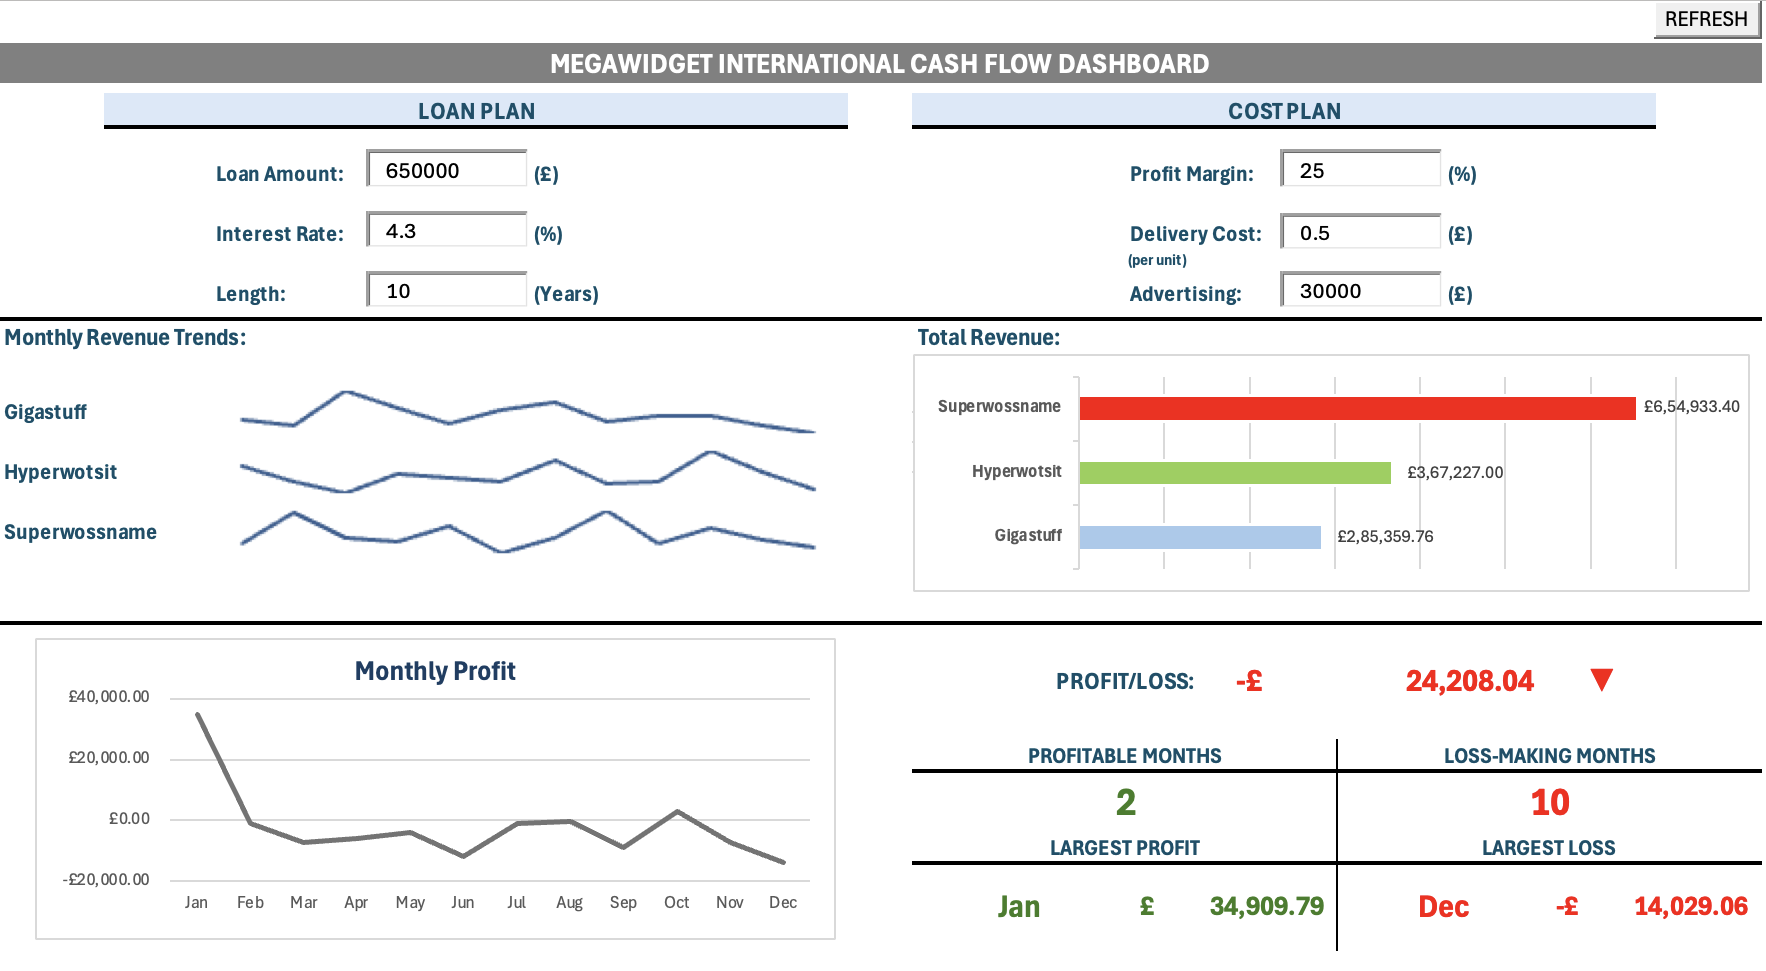
With a £650,000 loan over ten years at 4.3%, a 25% margin and £30,000 monthly advertising spend, the model produces losses in ten of twelve months.
An alternative case extends the loan to fifteen years, raises margin to 28% and reduces monthly advertising to £20,000. Under those assumptions, the model reaches £157,410 year-end profit.
Longer loan term
Reduces near-term repayment pressure while increasing the period of exposure.
Three-point increase
Improves unit economics, subject to the commercial reality of pricing.
Lower fixed spend
Improves cash but should be weighed against demand effects.
£14.95 per order
The partner offer could save up to 46% against the modelled alternative.
A proposed discount plan is also quantified rather than described vaguely: it reduces modelled revenue by roughly 4.7% and profit by roughly 6.8%.
A forecast range instead of false certainty
The workbook includes a deterministic 5% monthly growth case and a 1,000-iteration Monte Carlo simulation. The simulated range makes clear that a single point estimate is only one possible outcome.
In the documented run, the best monthly outcome exceeds £200,000, the worst falls below £50,000 and the average is approximately £87,000. These are model outputs, not guarantees.
Where the model needs judgement
The company and assumptions are illustrative. A real decision would require validated demand response, tax treatment, working-capital timing and the full cost of finance.
The model is still valuable because it makes those assumptions visible. Its conclusions should be read as scenario comparisons, not a claim that changing three cells will guarantee the optimised result.